KML is not so commonly used by mapmakers and GIS programmers.ESRI'S shapefile on the other hand is most commonly adopted in the field of GIS and therefore in this tutorial i will show how to convert between the two.

It is important to convert a shapefile(shp) to KML especially when you want to put it as an overlay in Google earth(accepts only KML or KMZ).

In this tutorial i will be using QGIS version 2.8.

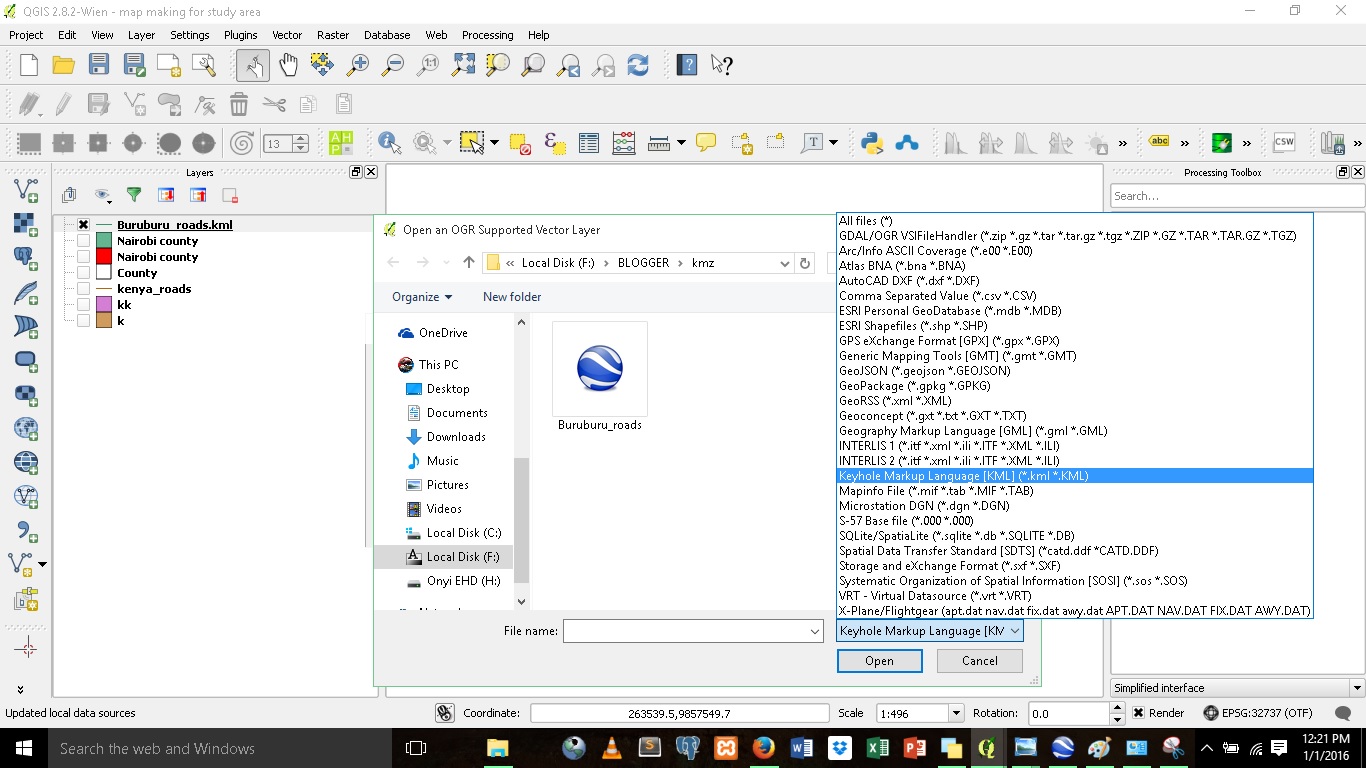
1.Select Layer in the menu bar and click 'Add vector Layer'.Browse to the KML file and in the 'source dataset type' select  'KML' or 'All files' and press open.


2.Right click on the added KML file on the side panel.Click on 'save as'.Select  ESRI shapefile under the format ,give it an appropriate name and click save.

The same procedure is followed when converting SHP to KML,only that the format this time round is KML.

You can also check on my tutorial on;

Exporting KML in Google Earth
Keyhole Markup Language(KML) is an XML based file format used to display geographic data in an Earth browser such as Google Earth and Google Maps.

In this tutorial i will be digitizing roads in Nairobi's BuruBuru estate where i live and then export the data to KML.The current roads shapefile that i have for the area is not up to date and this is one of the methods to get up-to-date data.

The software used is the Google Earth Pro.You can download it for free here if you don't have it installed.

1.Launch the Google Earth Pro and zoom in to your area of interest.I want to digitize roads so i will click on 'Add path' on the taskbar.Click on 'Add polygon' if your feature is a polygon or 'Add placemark' for point data.


 2.Enter the name for the layer and before clicking on 'OK' start digitizing.


3.Finally right click on the layer you have created on the side panel and save it as either KML or KMZ.KMZ is a compressed version of KML.It stands for Keyhole Markup language Zipped.


 You can also check on my tutorial 'How to convert KML to Shapefile and viceversa in QGIS'.

This tutorial explains how one can download Landsat images from the United States Geological Survey(USGS) website.There are no restrictions to downloading data from the site,however a statement of the data source when citing,copying or reprinting the data or images is requested.

The approximate scene size covered by the images is 170 km North-South by 183 km East-West .

Throughout this tutorial i will be using Mt.Kenya as my area of interest(AOI)

1.Visit the http://earthexplorer.usgs.gov/  website and log in or create an account if you have none.I already have an account so i will just log in.Its very easy to create one.

2.There are many options for selecting the area of interest;

(a)Using Address/Place.

Search your area of interest in the text box and click 'show'.My AOI is Mt.Kenya.
Thereafter click on the Adress to display a marker on the map as stated.


(b)Using Path/Row

The path and row is used as a worldwide reference system(WRS).The path is the descending orbit of the satellite and each path is segmented into 119 row,from North to South.The Landsat MSS sensor has 251 paths while the Landsat TM and ETM has 233 paths for complete coverage.

If you know the coordinates of any point in your area of interest,then you can go to the https://landsat.usgs.gov/tools_latlong.php website to determine its Path/Row.


Enter the path and row and then click 'show'.


(c)Using Features.

Enter the name of the feature and then click show.


(d)Use of coordinates

This is my favorite method.Click on 'coordinates',then on 'use map'.Thereafter select a polygon around your area of interest.


You can also use predefined areas(only applicable to features in U.S.A),or load a shapefile or a KML file.

For a shapefile make sure it is compressed into a single file using the ZIP archive file format and it must contain a shape format file (.shp), shape index format file (.shx), and attribute format file (.dbf). A shapefile may also include an optional projection format file (.prj).

You can view my tutorial on;

  Exporting KML files from Google Earth

 Converting between KML and ESRI'S Shapefile

3.The next step is to download the image covering the area of interest.
Click on 'Datasets' and choose a landsat sensor from the Landsat archive


4.Click on 'additional criteria' and check/select appropriate options.For instance you would want to reduce the cloud cover to the minimum provided so as to increase the clarity of the data.

5.The final step is to view and download the results.
Click on the results tab,choose the desired epoch and click on download.


Choose Level 1 product;it contains all the bands and this is useful for carrying out analysis in a remote sensing software.
In this tutorial i am going to show a context of a large scale map;this gives a sense of where it is in relation to a smaller scale map.

I am currently doing my final year project and my area of study is Nairobi County.Part of what is required in the write-up is to provide an overview map.

1.The first step is to load your area of study into the map canvas using the Layer>Add Layer and add the format that your data is in.For my case it's a shapefile.

2.Load the smaller scale map.For my case i want to give the context of Nairobi County within Kenya.

3. The next step is to compose a map.Go to Project>New print Composer and give it an appropriate name.


4.In the print composer window go to Layout>Add New Map or you may use the Add New map icon at the side bar.


5.Make sure that the the map you want to make is the one displayed on the QGIS canvas.Drag the rectangle on the the white area.Ensure you leave some space all around for the grid and the title.

You can mess around with the scale to ensure the map fits well in the box.
 Ensure that you have enough space where the smaller scale map will fit in.Use the Move item tool(Layout>Move item) to move the map around


6.After being satisfied with the larger scale map,Lock it by checking the lock check box.


7.Go back to the QGIS canvas and display the larger scale map.Zoom in to it.


8.Follow the same procedure as before to add the map onto the white box on the print composer.

You can once again change the scale to fit the map on the required area.
An arrow can also be added(Layout>Add arrow) to link the two


Finally you can export the map to a format of your choice;jpeg,svg or pdf.


1.I will be using QGIS 2.8 for this tutorial and an excel file containing X and Y coordinates of crops affected by bacterial diseases in Western Kenya.The data was collected using a handheld GPS.


2.In QGIS go to Layer>Add Layer>Add delimited layer.


3.Browse the location of the excel file and under the x-field,put the column containing the Easting,and y-field the northings.


4.Click OK and choose the appropriate reference system in the coordinate reference system selector window that pop-ups.


5.Finally,right click on the loaded excel file and save it as a shapefile.